An Open-Source Benchmark Suite for Microservices and Their Hardware-Software Implications for Cloud & Edge Systems
09 Oct 2022
| Link | https://dl.acm.org/doi/pdf/10.1145/3297858.3304013 |
| Year | ASPLOS 2019 |
Big Ideas
- Brawny == strong, wimpy == weak
Architectual Implications
Topdown Analysis
Figure 10 shows a top-down analysis of Social Network and E-commerce. The authors did not include figures for other workloads as they have similar observations.
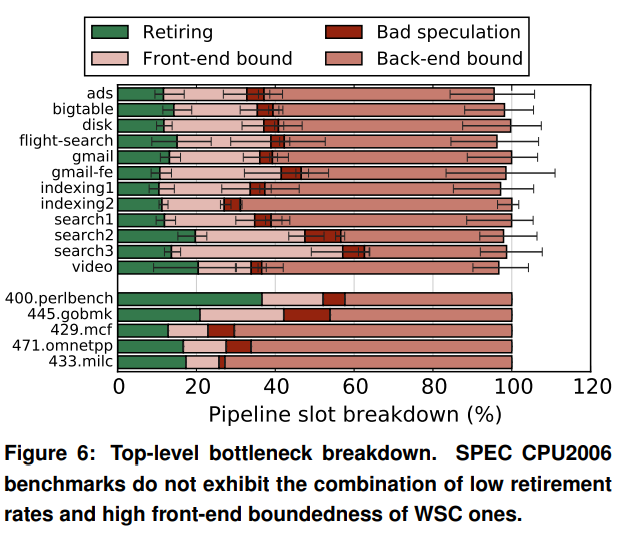
Overall, both workloads are front-end bound, with Social Network spending ~60% of cycles and Ecommerce ~40%. The authors claim that this observation is consistent with the ones reported in “Profiling a warehouse-scale computer” [1]. While both papers observe front-end stalls consume a significant amount of cycles, the Google work suggests that their workloads are on average ~60% bounded by backend stalls (Figure 6 below).
It is unclear why this difference (frontend vs. backend bottleneck) is present. One possibility is that since Google workloads are already heavily optimized, most of Google’s frontend bottlenecks have been resolved through e.g. prefetching optimizations. Another possibility is the Google workloads have larger input data sets/working set sizes, causing more backend stalls.
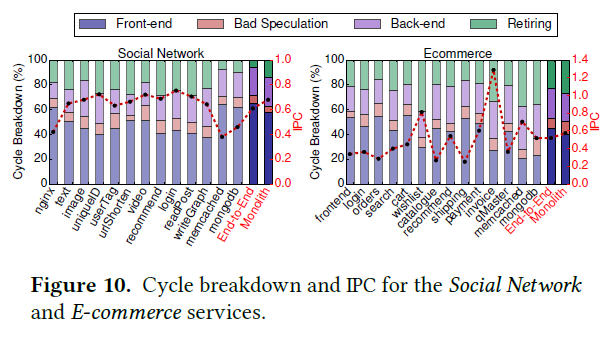
As a minor note, the authors mention that “only a small fraction of total cycles goes towards committing instructions (21% on average for Social Network), denoting those current systems are poorly provisioned for microservices-based applications.” I believe this issue of low commit percentage is not only a problem for microservices but a general issue for modern big data applications. As processor scaling slows down and application memory requirements increase, the performance bottleneck shifts from the CPU to the memory system. I believe the frontend and backend bottlenecks are natural consequences of this trend.
Instruction Cache Pressure
The authors conclude that microservices achieve better i-cache locality than monolithic applications since microservices have smaller code footprints. Despite this, I don’t quite understand the reason behind this. Even for monolithic applications, I imagine each server would only execute a portion of the binary. E.g. one server will be responsible for the search functionalities, and another server for managing the login. If that is the case, shouldn’t monolithic have good instruction locality as well?
- It seems that for monolithic applications, individual servers do not perform a single task, but rather perform several tasks. In that case, it makes sense for microservices to have better instruction locality.
Brawny vs. Wimpy Cores
The simple vs. complex cores seem to be one of the ongoing debates in the architecture/systems community. One of the key insights from the multi-core era was to prefer simpler cores vs. fewer complex cores. The brawny vs. wimpy debate appears to be similar, but the main motivation seems to be power efficiency. More reading on this topic is required for further comments.
The authors observe that microservices are more sensitive to single-thread performance than monolithic applications. The reason is because individual microservices need to meet more strict tail latency requirements compared to an end-to-end monolithic counterpart. This makes sense. Recall that in a monolithic application, each server performs several tasks. Since a monolithic server performs more tasks than a microservice server, the former is more likely to have longer latency. This is similar to the fact that the tail latency of 10 machines is higher than 1 machine (assuming the machines are identical), as it is more likely for something to go wrong (tail) within 10 machines than 1 machine (see [3,4] for details).
OS & Network Implications
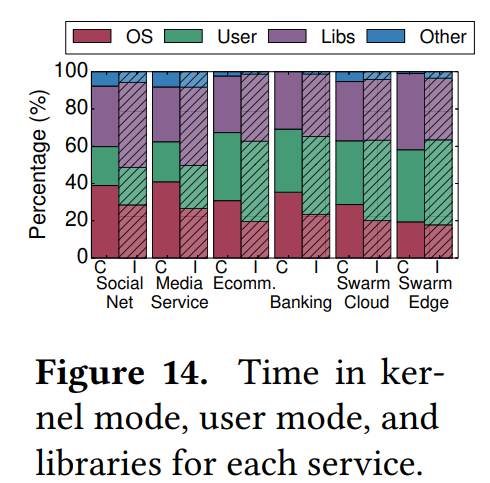
The first observation is that microservices spend a large portion (20-40%) of execution time in kernel mode. The main contributors are memcached, network traffic, and low-level libraries (e.g libc, libgcc, libstdc). This is surprising, as Figure 14 shows that only 20-40% of execution time is spent on the service itself (User). In Figure 14, C stands for cycles and I instructions.
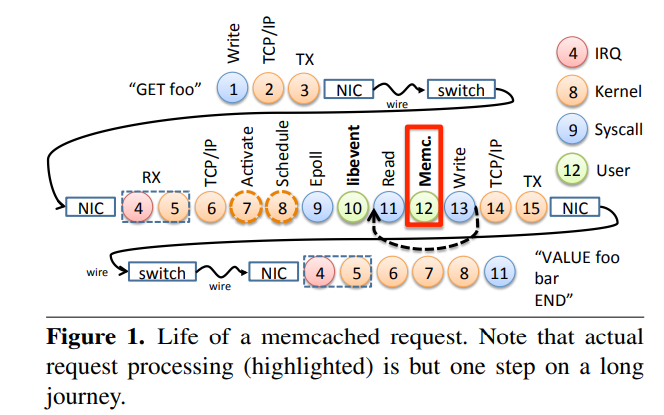
It was surprising that an application like memcached would be kernel dominated. After looking into [2], this seems to be indeed the case. In Figure 1 below (figure from [2]), 17% of memcached’s runtime is spent in user code vs. 83% in kernel code. The actual “useful” memcached work is step 12.
However, I imagine this example is an extreme case within all data center workloads. Given the fact that most data center workloads today are memory-bound [1], the bottleneck should exist in the user portion of the execution pipeline (since the network stack is typically not memory intensive). More readings are needed.
The authors attribute the large fraction of execution time in libraries to the philosophy behind microservices: optimizing the speed of development, thus heavily using existing libraries. I do not know enough about microservices yet to comment on this conclusion.
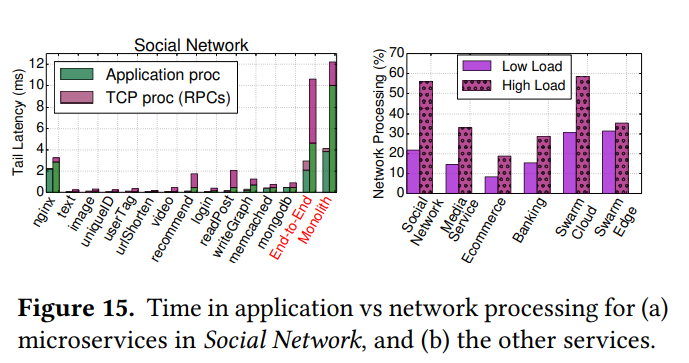
Network Processing vs. Tail Latency
Figure 15 (a) shows that the presence of a high load significantly worsens the network’s contribution to tail latency. The authors attribute this effect to the queuing effect in the NICs at high loads. This figure also shows that the network latency of the monolithic counterpart is significantly lower due to the reduced network communication. I am not sure why the monolith has longer application latency. Figure 15 (b) shows that at high load, network processing is a significant portion of the tail latency, ranging from 20-60%.
To accelerate this bottleneck, the authors propose to offload the TCP stack to an FPGA. I believe Microsoft Catapult [5] did this as well, although the exact design might be different.
Cluster Management Implications
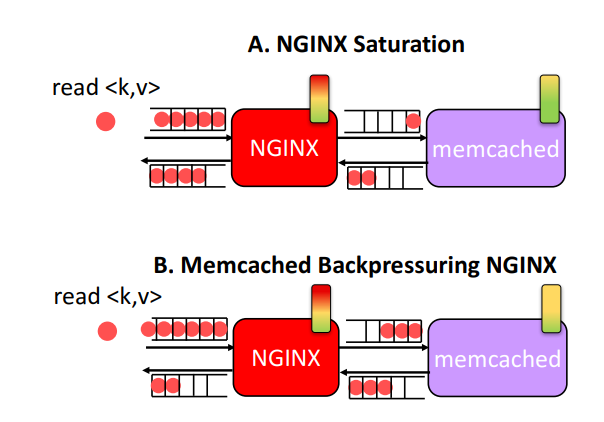
Since microservices have dependencies between each other and individual microservices can have different throughputs, backpressure effects often cause hot spots in the system. E.g. in the figure B below, if memcached is slower than NGINX (load balancer), NGINX will not be able to operate with the max performance.
Even worse, the authors observe that current cluster managers will provision more resources to NGINX in figure B, since the input of NGINX appears to be more utilized, even though the root cause is the slower memcached. The conclusion here is that cluster managers should be aware of the dependencies between microservices when allocating resources.
Cascading Hotspots
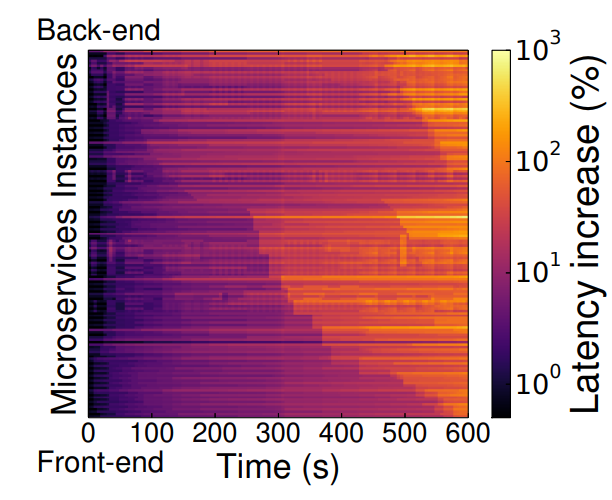
Similar to traffic jams, a slow microservice also causes a cascade of slowdowns for upstream services. The figure below shows this phenomenon. The pipeline starts from the bottom (frontend) and ends at the top (backend). The waterfall pattern shows the backpressure effect propagating all the way to the frontend. In reality, I imagine people would apply a variety of techniques such as latency-induced probation [3] to prevent such things from happening.
Thoughts and Questions
-
The main strength of this paper is the fact that the authors analyze microservice performance from different angles: hardware, OS, network, cluster management etc. Due to the page limit, the paper could only dedicate one section for each angle, but it would be interesting to see dedicated studies on the individual angles. I personally would be interested to learn the detailed memory access patterns for each workload.
-
The amount of engineering effort that went into developing the workloads is impressive (see Table 1), given the fact that each workload consists of tens of individual microservices.
-
Why do microservices have better instruction locality than monolithic applications?
- For monolithic applications, individual servers perform several tasks, resulting in worse instruction locality compared to microservice servers, which perform a single task.
Sources
[1] https://static.googleusercontent.com/media/research.google.com/en//pubs/archive/44271.pdf
[2] https://dl.acm.org/doi/10.1145/2592798.2592821
[3] https://research.google/pubs/pub40801/
[4] https://kevins981.github.io/2022/03/20/tail_at_scale.html
[5] https://www.microsoft.com/en-us/research/project/project-catapult/