#26 Profiling a warehouse-scale computer
15 Sep 2022
| Link | https://static.googleusercontent.com/media/research.google.com/en//pubs/archive/44271.pdf |
| Year | ISCA 2015 |
The Big Ideas
- Google data center workloads are memory latency bounded (up to 60% of all cycles).
- Low memory BW utilization (95th percentile is 30%) -> optimizing for latency is more important
Backend Boundedness: Memory Bottleneck
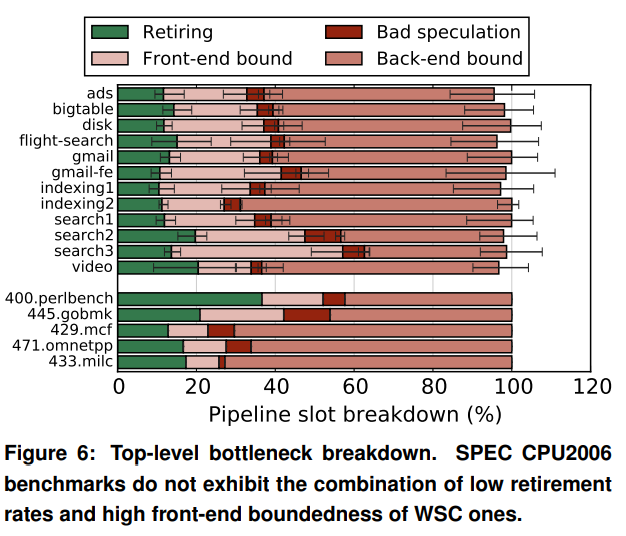
Figure 6 is, in my opinion, the most important result in this paper, because it shows that the dominant bottleneck in Google workloads is memory. Unfortunately, the analysis of this major bottleneck is lacking. The only explanation seem to be in the title of section 7 (dependent accesses) and the bandwidth experiments in Figure 13). Perhaps the student did not have access to the workloads and was only given the execution traces, thus can only infer the cause of the memory bottleneck.
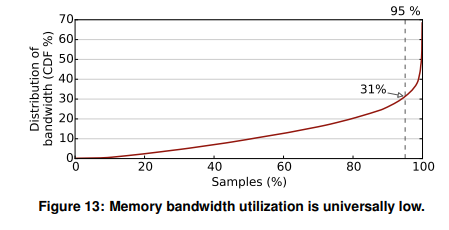
Since Figure 13 shows that BW utilization is low, then the memory bottleneck is caused by high data access latency. Based on the formula access latency = hit% * hit time + miss% * miss time, and the fact that the hit and miss times do not change across workloads, the high data access latency should be a result of a high cache miss rate. There can be multiple causes for the high miss rate. I can currently think of two: independent random accesses and dependent random accesses. Here, by random, I mean any access pattern that the prefetcher cannot identify. Note the difference: random accesses do not have to be dependent on each other. If dependent accesses end up being sequential, then the miss rate will be low.
int arr[16] = {1,2,3,...,16}
prev = 0
for i from 0 to 15
    read arr[prev]
    prev = arr[i]
Here, reads to arr are dependent (loop carried). However, the accesses end up being sequential, and there will only be one cache miss for all 16 loop iterations.
So there are two potential causes of high cache miss rate: independent random accesses and dependent random accesses. If the high miss rate is caused by the former, then the memory BW utilization should be high, as [1] shows that the DRAM BW should be saturated even under random accesses. So I agree with the author’s hypothesis that the memory bottleneck is caused by dependent accesses that cannot be effectively prefetched.
However, a distinction should be made on whether the dependent accesses cannot be effectively prefetched by automatic solutions (e.g. hw prefetcher, gcc sw prefetching), or is prefetching impossible (e.g. it is not possible to know the location of the next address ahead of time)? Given that these Google workloads are likely already highly optimized, I imagine there are already explicit prefetching optimizations in the code. Or perhaps doing so is too costly in terms of engineering and thus a better programmer-assisted prefetcher is required?
Memory Bandwidth Underutilization
Back to Figure 13. The fact that 95% of the sample traces show memory BW utilization of less than 31% is unexpected. This means the memory BW is overprovisioned. So what can we do about this?
- We most likely cannot cut back the number of DIMMs to reduce the max BW, as this will also reduce the memory capacity, which has become a major bottleneck for modern workloads.
- We might be able to run more applications on each server to increase the BW utilization. But this also may not be possible, as there may be other resource bottlenecks such as the number of cores. I am willing to believe that Google has a somewhat optimized way to assign apps to servers.
Note that the DRAM latency will increase as the BW utilization increases (loaded latency). Perhaps 31% BW utilization is not terrible considering the overall performance.
This abundance of DRAM BW may be good news for multi-tiered memory systems. The application can perform more aggressive prefetching from lower-tier memory (e.g. CXL memory) to DRAM to tradeoff BW for latency, although in this case, the best possible latency is DRAM latency.
Workload Diversity
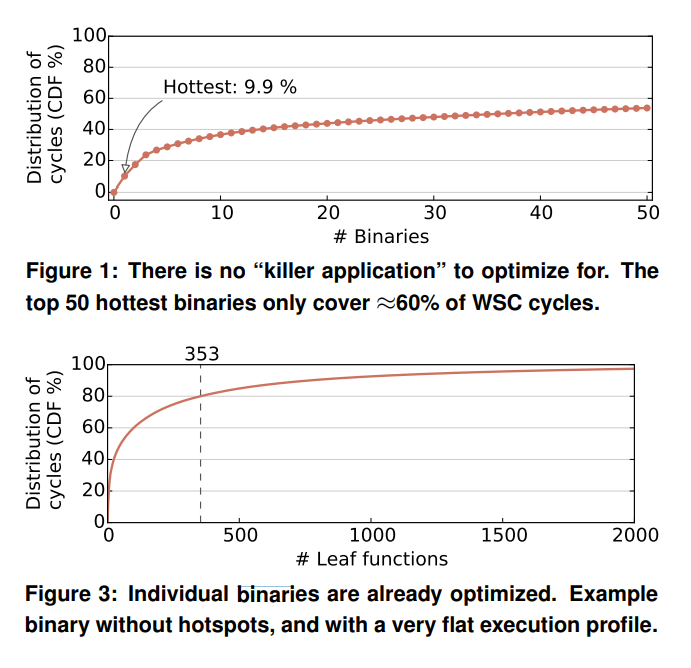
The main idea of this section is that the authors observe that there is no clear hotspot in terms of the profiled binaries and functions in each binary. The hottest binary “only” consumes 9.9% of total cycles in the data center. I would imagine that 10% of Google data centers is still a huge amount of cycles and worth optimizing for. In addition, one dimension that is lacking from Figures 1 and 3 is whether there are similar computation/memory access codes across binaries (in addition to the data center taxes). For example, perhaps half of the 50 hottest binaries heavily use breath first search. Although given a large number of leaf functions in each binary, this dimension may or may not be significant.
One interesting observation from Figure 3 is that the distribution follows the 80-20 rule quick closely: 18% (353/2000) of the leaf functions do 80% of the work (total cycles). The authors mention that this contrasts with the data analytics workload from CloudSuite, which has 3 functions contributing to 65% of the runtime. Well, how many functions are in this data analytics workload in total? Furthermore, perhaps we should be looking at the number of lines of code instead of the number of functions. Within a hot function, there could be also hot instructions (e.g. repeatedly executed loops). Perhaps a lines of code vs. distribution of cycles graph will tell a different story.
Datacenter Tax
Since there are few opportunities to optimize WSC workloads using Amdahl’s law in the binary/functions dimension, the authors try to look for dominant common denominators across binaries, shown in Figure 4. While the result of 22-27% of all WSC cycles seems to suggest that there is a dominant bottleneck in the data center taxes, note that this is 6 categories of taxes combined.
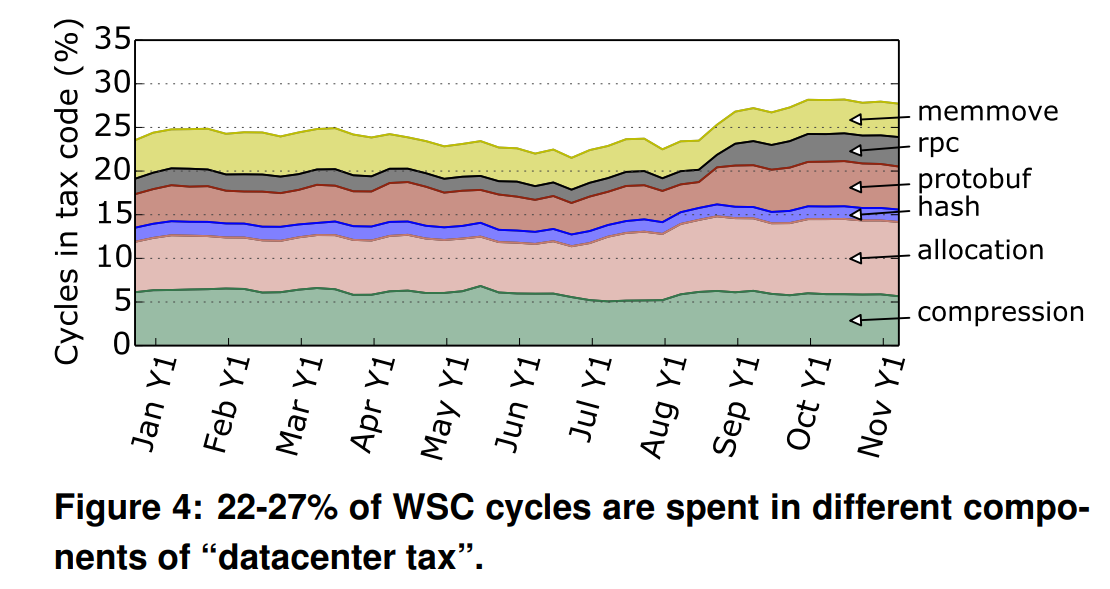
The most cycle-consuming tax is memory allocation, consuming a bit less than 10% of total cycles. This is surprising. I did not know memory allocation was such a cycle-intensive kernel. Does the number of cycles consumed include time spent waiting for memory? The authors mention that memory allocations involve recursive data structures, which I assume are also stored on the DRAM. If these access to recursive data structures exhibit dependent accesses that are difficult to prefetch, then this bottleneck makes sense. Unfortunately, similar to dependent data accesses, the analysis on allocation is again somewhat shallow.
Note that Figure 1 shows that the hottest binary also consumes ~10% of total cycles. Not sure why the conclusion of Figure 1 is “There is no killer application to optimize for” while the conclusion here is data center taxes are “prime candidates for hardware acceleration.”
Another question is, can all allocations be treated the same? Are certain allocations more cycle-intensive than others? Are there hotspots within memory allocations (i.e. are there code regions within the allocator that are hot?)
Aside: The idea of data center tax has been echoed by other works such as [2], although the definition of “datacenter tax” seems to be somewhat different between these two works. In this work, tax taxes are “common building blocks” between various workloads, some of which are integral parts of the program. The workloads cannot run without these taxes (e.g. memory allocation), even on a single node. In my opinion, Meta’s “datacenter tax” is closer to being a “tax”, which includes e.g. logging and routing. On a single machine, the workloads can still run without taxes. This is a small distinction that does not affect the contributions of this paper from Google, but it is interesting to see the fact that there seems to be no standard definition of data center tax yet.
Thoughts and Questions
-
This paper provides valuable insights into the characteristics of real production workloads, which inspired much future research. Comparisons against prior benchmarks are also valuable.
-
The analysis of the main bottlenecks, in particular, dependent data accesses and memory allocation, could have been more in-depth. This is likely because Google does not wish to release certain details about their workloads.
-
What are some general techniques to reduce high data access latency? Prefetching is one option. How effective can process-in-memory be for these workloads? What are some other approaches?
-
In addition to hardware prefetching, and compiler-based prefetching, programmers can also perform software prefetching explicitly based on their understanding of the program. While the last option is likely the most flexible and performant, it often requires expertise and a considerable amount of engineering effort. My question is: how much performance improvement can a program achieve if we have the most optimal explicit software prefetching? By optimal I mean the fastest end-to-end runtime. Is this a 10x speedup? 2x? or closer to 1.05x? I am guessing that Google workloads have been heavily optimized already, which includes prefetching optimizations. How do these heavily optimized workloads compare to the optimal performance?
- In addition, not everyone has the expertise and engineering power that Google does. Would be a shame if these prefetching performance opportunities are lost just because someone does not have these resources. Need to do more readings on this…
Sources
[1] https://arxiv.org/pdf/1908.03583.pdf
[2] https://www.pdl.cmu.edu/ftp/NVM/tmo_asplos22.pdf