Common Numbers You Should Know
29 Jan 2022
This post is inspired by Jeff Dean’s list of “Numbers Everyone Should Know”. I wanted to 1) update Jeff’s numbers to reflect the latest generation of technologies 2) add more relevant numbers that are not covered in the original list.
| Op | Number | Notes |
|---|---|---|
| L1 cache | 0.5-1ns, 1TB/s, 80KB (Silver 4314) | L1 access takes ~4 CPU cycles. For a 4GHz CPU, this is ~1ns [1]. The capacity includes both instruction and data. It seems like the i and d-cache sizes are similar. |
| L2 | 5ns, 1TB/s, 1.3MB per physical processor (Silver 4314) | ~10 cycles. Note that L2 may be shared by two cores [1] |
| L3 | 50ns, 500GB/s, 24MB (Silver 4314), up to 48MB (Gold 6338N) | Silver 4314 seem to have one L3 per socket (source: output of lscpu --caches) |
| Main memory (DDR3) | 100ns, 10GB/s, ~1GHz | [2] Not sure how up to date the 100ns latency is. |
| Main memory (DDR4) | ?ns, 30GB/s, ~3GHz | [3] Not sure how up to date the 100ns latency is. |
| Main memory (HBM) | ?ns, 200GB/s | Need to verify |
| SSD | 20us, 10GB/s | [4] but sources such as [6] suggest SSD bw can be lower than 1GB/s |
| NVM | 300ns, 5GB/s | [5] |
| Hard disk drive | 10ms, 100MB/s | [6] |
Network
| Op | Number | Notes |
|---|---|---|
| 2kB over 1Gbps network | 16us | Theoretically this should take 16us, since 1Gbps means 1ns per bit. I am seeing 400us between my 1Gbps workstation and server (~20meters apart). Why is this? Likely because of latency. |
| Round trip time within same data center | 500us | What does this mean? Time between two servers in the same datacenter? Why is it 500us? Does it have to do with network speed vs distance? Speed of light is approx 300m/us. |
| Round trip time from California to Europe | 150ms | Distance between California and Europe is about 8000kM [9]. Assuming network packets travel at the speed of light, a round trip would take ~50ms. This probably means the network travel speed is slower, which is expected. |
- Seems like some of [8] numbers are based on prediction models of past papers. We should try benchmarking some of these numbers ourselves.
Availability Levels [7]
Number of seconds in a day = 86400; Number of hours in a year = 8760
| Nines | Downtime per year | per day |
|---|---|---|
| 90% | 37 days | 2.4hr |
| 95% | 18 days | 1.2hr |
| 99% | 5 days | 14min |
| 99.9% | 9 hr | 1.4min |
| 99.99% | 53 min | 8.6s |
| 99.999% | 5 min | 0.9s |
- Difference between 4 nines and 5 nines is 10x, since 0.01% vs 0.001% downtime
- There are 24*60*60 = 86400s in a day. 0.001% downtime is 0.86s or approx. 0.9s (or approx. 1s?)
what is required in practice to get 5 nines? If I need to design such a system, what optimizations would I need to do?.
Binary Numbers
| 2^10 | 10^3 | 1k |
| 2^20 | 10^6 | 1M |
| 2^30 | 10^9 | 1G |
| 2^40 | 10^12 | 1T |
| 2^50 | 10^15 | 1Peta |
| 2^60 | 10^18 | 1Exa |
Misc
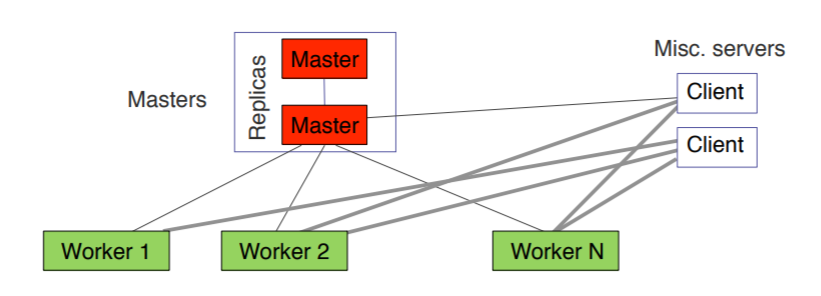
How can Raft afford to use a single master to serve all client requests? Does this not create a performance bottleneck? .
Sources
[1] https://www.intel.com/content/www/us/en/developer/articles/technical/memory-performance-in-a-nutshell.html
[2] https://www.kingston.com/en/memory/ddr3-1600
[3] https://www.crucial.com/support/memory-speeds-compatability
[4] https://en.wikipedia.org/wiki/Solid-state_drive
[5] https://arxiv.org/pdf/1903.05714.pdf
[6] https://tekie.com/blog/hardware/ssd-vs-hdd-speed-lifespan-and-reliability/#:~:text=A%20typical%207200%20RPM%20HDD,s%20to%20550%20MB%2Fs.
[7] https://sre.google/sre-book/availability-table/
[8] https://colin-scott.github.io/personal_website/research/interactive_latency.html
[9] http://distancebetween2.com/california/europe#:~:text=The%20total%20straight%20line%20distance,to%20Europe%20is%205171.2%20miles.